Analyzing Cycling Gear Use
Originally Posted: October 12, 2015
Gearing on a bicycle enables the rider to traverse differing terrain while maintaining a comfortable pedaling speed, known as “Cadence”, and road speed. For instance, a cyclist with just one gear, riding on flat terrain at 20 mph and pedaling at 90 RPM would have to slow their pedaling speed to just 45 RPM while riding uphill at 10 MPH. Not only is pedaling at 45 RPM going uphill difficult, it also puts excessive stress on the rider’s body and is inefficient; most people’s optimal pedaling speed is 90RPM (Neptune, Journal of Biomechanics 409-415). Thus, it is desirable to have a set of gear ratios to use while traversing varying terrain.
The race for market share in the world of cycling while trying to meet this need has driven growth from bicycles with 10 speeds in 1983 to cycles with 20+ speeds in 2015. This level of gearing requires narrower chains and higher precision shifting mechanisms, thus adding cost and complexity to the machines. It is interesting to note that while the number of gears on a racing bike has steadily increased, the gearing range hasn’t. This has resulted in redundant gear ratios throughout the available range on most bikes. New drivetrains are now placing an emphasis on simplicity by including fewer gears in total while providing a similar number of unique gear ratios. To understand how many gears are truly needed, the author analyzed gear usage during rides on a variety of terrain.
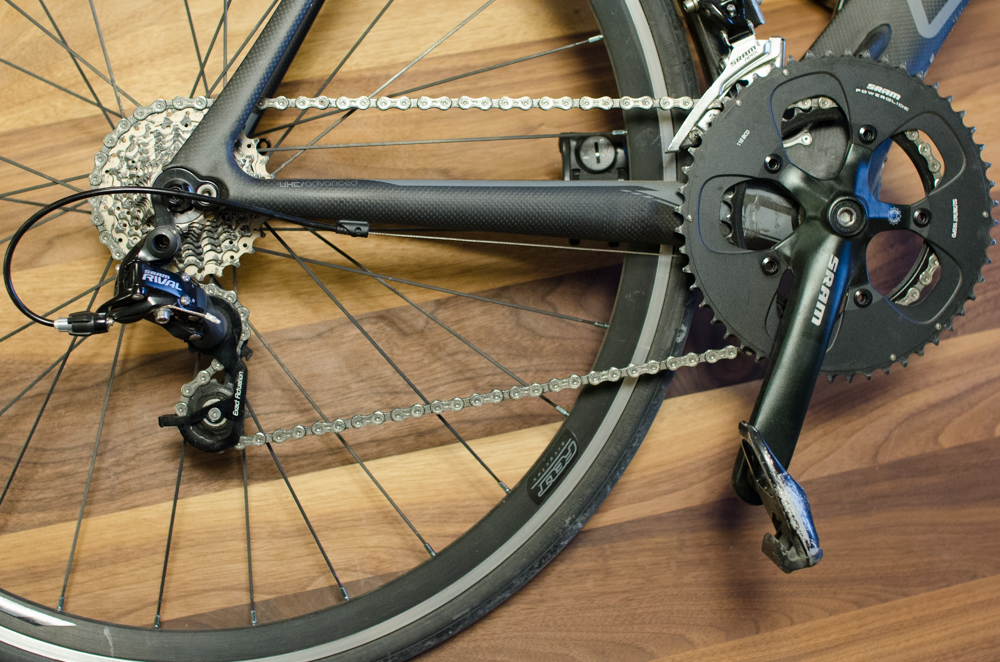
The most common type of bicycle drivetrain makes use of two sets of sprockets: the crankset which is located near the center of the bike, and the cassette which is attached to the hub of the rear wheel. Figure 1 provides a graphic illustration of this layout.
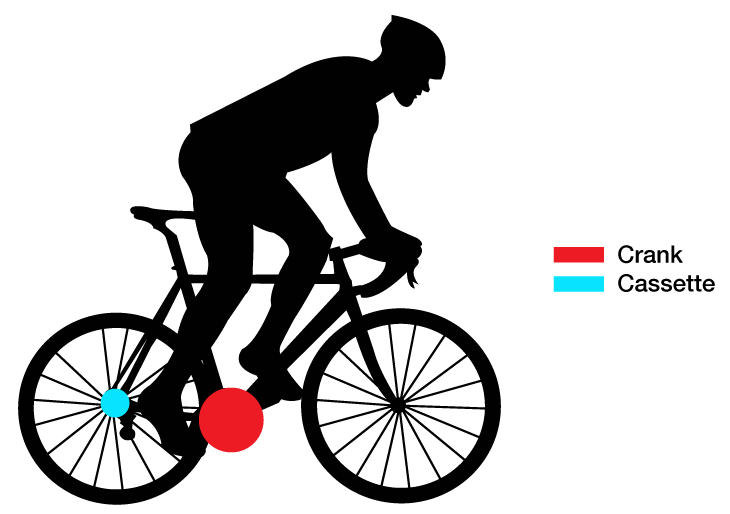
The combination of gears in the crankset and cassette gives the total number of gear ratios and gearing range available to the rider. For instance, if the crankset has 2 sprockets and the cassette has 8, then there are a total of 16 gear ratios for the rider to make use of. Depending on terrain, a rider will choose a given gear ratio by selecting a specific pair of sprockets from the crankset and cassette.
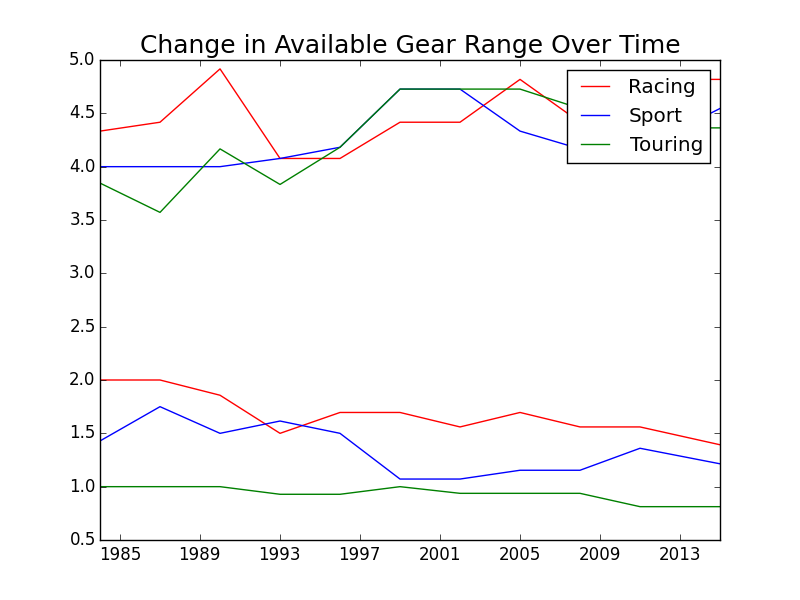
The change in gearing over time for three segments of Trek road bicycles is analyzed: touring, sport, and racing. The touring segment is focused on the classic 520 series bicycle while the sport and racing segments follow the entry level and high-end offerings from Trek. Figure 4 shows how the number of gears on bikes in these segments has changed from 1983 until 2015. From this data it is clear that the number of gears on Trek’s bicycles has steadily increased since the 1980’s, with much of the growth coming from a higher number of sprockets in the cassette.
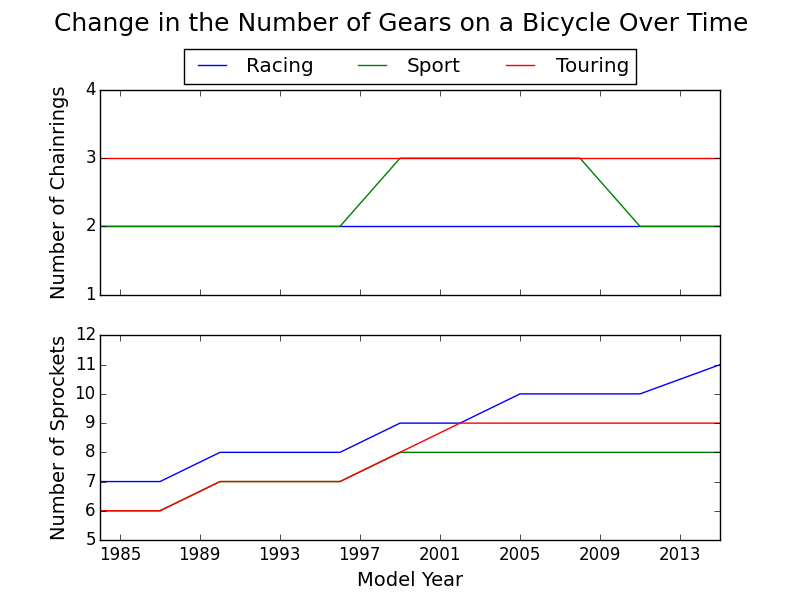
Another key metric of bicycle drivetrains is the range of gear ratios provided. This is essentially the difference between the “Easiest” and “Hardest” gears available. Figure 5 explores the change in available gear range over time. It is interesting to note that touring bikes have a similar width of gears available but the range itself is shifted lower relative to sport and racing bikes. This is likely accomodate riding with the extra weight of gear and equipment, albeit at a slower speed.
Analysis of Riding Data
Thanks to speed, cadence, and GPS recording devices I have a plethera of data available from my own riding. Since the gear ratio in use isn’t directly recorded it is inferred from the ratio of pedalling cadence to wheel speed. The following steps were taken to analyze my riding data and calculate the usage frequency of each gear ratio.
- Convert ride data in FIT file format to tabular comma seperated data
- Clean data as needed (For instance, removing periods where the pedalling cadence is near zero)
- Estimate gear from speed and cadence data
- Compare usage between different types of terrain
Rides were grouped into three categories according to their terrain type: Flat, Rolling, and Hilly. These groups correspond to rides with 210m or less of elevation change, rides of 210 to 500m of elevation change, and rides with more than 500m of elevation change respectively. Figure 6 shows the distribution of gear usage for these ride types. Qualitatively, it can be seen that on hilly rides more time is spent in the low and high gear ratios than on the flatter terrain types. This is likely due to the additional time spent climbing at slower speeds, which require a low gear, and descending at higher speeds, where a high gear would be used.
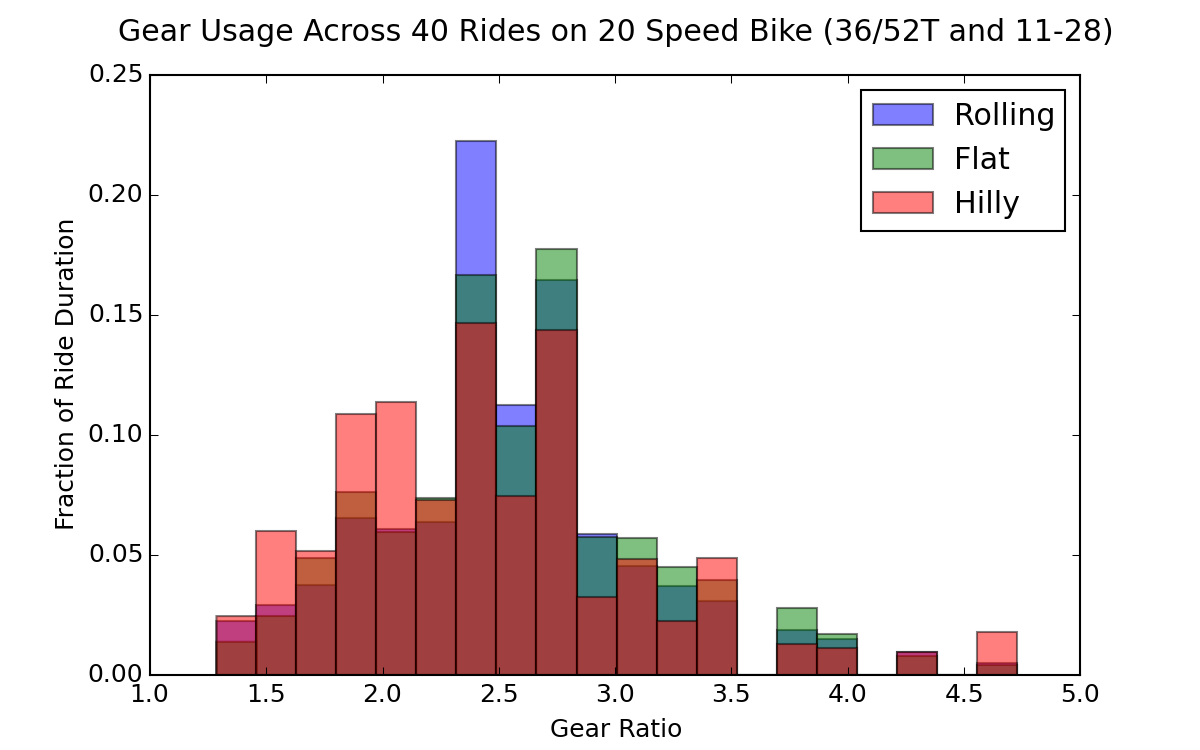
It is interesting to note that for the flat and rolling terrain types, on average, nearly 50% of the ride was spent using just 3 of the 20 speeds available. In contrast, the hilly rides do not have as dominant usage of just a few select gears.