
Bradford Levy
Nurturer of Improbable Ideas
I am an Assistant Professor at Chicago Booth and my research aims to provide data relevant to questions of public interest—with particular emphasis on AI, information, and financial markets. My work, in collaboration with my co-authors, has been published in venues such as NeurIPS and Management Science, and helped inform several policy changes such as:
- Amendments to Reg NMS increasing competition and new rules governing best execution—regarded as the most significant changes to markets since Reg NMS's introduction
- A United States Senate Bill addressing inequities in the laws that govern executives’ behavior
- New rules introduced by the United States Securities and Exchange Commission (SEC) to increase transparency into corporate governance
- SEC rules to ensure fair access by mandating electronic filing of all corporate disclosures—guided by my dissertation
I have been quoted and cited by business publications such as the Financial Times, Bloomberg, Wall Street Journal, and Grant’s Interest Rate Observer (March 2021), as well as several centers for thought leadership such as the National Bureau of Economic Research, Harvard Law School, Cooley PubCo, and Law360. I actively engage with practioners by consulting on analytics and machine learning for such clients as a Big 4 auditor and the United States Department of Justice. My CV is available here.
Previously, I spent nearly a decade in tech and automotive where I led analytics, software development, and design teams. During this time, I was granted patents in artificial intelligence and safety technologies. In my free time, I love to cook—particularly developing meal plans that minimize our household’s waste—and exercise.
BUSN30135 - W25 - AI & Financial Information
Originally Posted: March 17, 2025
For Winter 2025, I taught a new course, AI & Financial Information. The course structure mimicked what one might find in a physics or chem course: lecture and discussion to cover theoretical aspects of a given topic followed by a lab in which students gained more practical experience. Grades were based largely on a final project of the students’ choosing which was presented to a panel of experts from Anthropic, DRW Trading, EY, Goldman Sachs, Microsoft, Princeton, SECOR, and boutique VC.
I was overwhelmed by the diversity and quality of the projects. Below are a sample of the projects based on whether the students “opted-in” to public sharing. The 🏆 emoji indicates that the project won the “People’s Choice” award—which was a two-way tie.
- Evaluating Consumer AI products for Financial Analytics
- Identify non-recurring expenses and revenues not relevant to core operations of a business
- Using AI to Compute a Personalized ESG Rating
- Automating the creation of draft take-private screening for potential public company targets.
- StockSage: Knowledge-Augmented Loser Stock Predictor
- Preventing the Next Enron: Using Graph-Based RAG on Enterprise Data for Fraud Detection, Compliance, and Operational Efficiency
- Simplifying ESG Investment using AI
- 🏆Jaid - a Personalized Investment Newsletter with Sentiment Analysis
- VC investment decision AI agent
- 🏆AI-powered Red & Blue Team integration
- Finance Bro - Invs. Banking Prep Coach
✅💯 Booth RP 2023 Interviewing: Set up for success
Originally Posted: May 07, 2023
This post is meant to help “level set” across candidates interviewing for my Research Professional position at Chicago Booth in Summer 2023. Interviews will last 45 minutes, allocated as follows:
- 🫱🫲 Introduction (5 min)
- 📡 Data collection (15 min)
- 📊 Data processing (15 min)
- 🧐 Interviewee questions (10 min)
The goal of the interview is to assess your ability to think through a problem and develop a solution. While it is great if you can write functional code in real-time, that is not necessarily expected. To that end, focus on the problem itself and conveying how you are thinking about it, possible solutions, and the pros and cons associated with the solutions you envisage. Thinking out loud is great!
Continue reading to learn about setting yourself up for success during the interview.
Price Improvement and Payment for Order Flow
Originally Posted: June 30, 2022
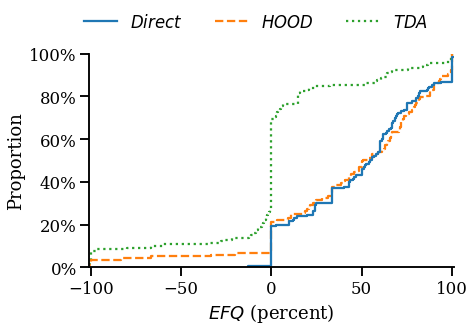
In a new study, I use a randomized controlled trial to examine the effect of payment for order flow (PFOF) on price improvement (PI). The results suggest the national best bid and offer overstates PI by as much as 400%, and that PFOF can benefit investors, but significant heterogeneity exists across brokers. The results highlight important policy implications, specifically the need for better measures of market conditions, execution quality disclosures, and a more precise definition of “best execution.”
Along these lines, the SEC cited this work in December 2022 proposals which would amend Regulation National Market System (Reg NMS) with the goal of increasing competition and new rules governing best execution—changes which have been regarded as “biggest shakeup to stock market rules since the SEC introduced Regulation National Market System in 2005[.]”
Search-Based Peer Groups - Aggregating SEC EDGAR Searches to Beat SIC Codes
Originally Posted: January 01, 2018
In this post, I show that search-based identification of peer firms yields groups which transcend traditional industry classification codes and use stock return data to show that they are more economically related. This indicates that investors may be better off using more novel means of finding comparable companies than relying solely on traditional Standard Industrial Classification (SIC) codes. Building upon my last post, SEC Filings Graph, which explored logs from one year of searches on the SEC’s EDGAR website to identify related companies, I expand the data to searches from January 2008 through March 2017 and implement quantative measures of economic relatedness between the firms within a peer group. The resulting dataset (previous dataset) has 407,574,804 (52,611,188) searches for 9,583,773 (5,388,574) reports by 3,043,255 (476,827) users. My work is inspired by, and roughly follows, the methodology of Lee et al. who studied search data for 2008 through 2011.
SEC Filings Graph - Identifying Related Firms From More Than 52 Million SEC EDGAR Searches
Originally Posted: November 26, 2017
Graphs let us model the world as it is, with nodes that represent physical entities and edges connecting nodes based on the relationships between them. Inspired by the work of Lee et al., I took the Thanksgiving weekend to build a graph of SEC filings. In this post, I use the EDGAR Log File Dataset, from April 2016 through March 2017, and Neo4j to build a graph of 52,611,188 searches for 5,388,574 reports by 476,827 users. The graph leads to interesting connections between firms and could be extended to include more relationships and entities from other domains such as textual similarity of filings, employment histories of material employees, and patent applications.
305 Million Solutions to The Black-Scholes Equation in 16 Minutes with AWS Lambda
Originally Posted: May 28, 2017
The research I’m working on involves estimating a firm’s probability of default over a variety of time horizons using the Merton Distance to Default model. The dataset contains daily financial information for more than 24,000 firms over the past 30 years. Given that I am calculating the probability of default over five time horizons, applying the Merton model will require solving the Black-Scholes equation roughly 305 million times. Luckily, the model is easily parallelized because the only data needed for the model, aside from the risk-free rate, is firm specific. This post shows how the Python library Pywren can leverage AWS Lambda to run hundreds of models in parallel, achieving a 270x speed-up over a quad-core i7-4770, with minimal changes to the simulation code. If you are interested in learning more about the model, see my post about implementing the model in Python.
Assessing Credit Risk with the Merton Distance to Default Model
Originally Posted: May 20, 2017
One of the most effective methods for rating credit risk is built on the Merton Distance to Default model, also known as simply the Merton Model. While implementing this for some research, I was disappointed by the amount of information and formal implementations of the model readily available on the internet given how ubiquitous the model is. This post walks through the model and an implementation in Python that makes use of Numpy and Scipy.
Production Planning within a Seasonal Industry
Originally Posted: March 02, 2016
One challenge facing companies that manufacture products with highly seasonal demand is the choice of production scheduling. One option is to make a fraction of the expected demand each month leading up to the peak season. But, when demand is uncertain this approach can lead to large overages or shortages that erode margins. Firms that find themselves in this situation must balance the costs of ramping production to meet demand during peak season, additional inventory holding costs, and the risk of uncertain demand.
The case of Play Time Toy Company1 is used to explore solutions to this dilemma. Specifically, using Monte Carlo analysis to assess the impact of production scheduling on firm profitability and capital requirements.
Formal and Informal Structures of Organizations
Originally Posted: December 08, 2015
This post examines how the formal structure set by managers can differ drastically from its informal structure which dictates how information flows within the company.
Investment Portfolio Optimization
Originally Posted: December 04, 2015
The need to make trade-offs between the effort exerted on specific activities is felt universally by individuals, organizations, and nations. In many cases, activities are mutally-exclusive so partaking in one option excludes participation in another. Deciding how to make these trade-offs can be immensely difficult, especially when we lack quantitative data about risk and reward to support our decision.
In the case of financial assets, there is a wealth of numerical data available. So in this post, I explore how historical data can be leveraged to choose specific mixes of assets based on investment goals. The tools used are quite simple and rely on the mean-variance of assets’ returns to find the efficient frontier of a portfolio.
Note: The code and data used to generate the plots in this post are available here.
Analyzing Cycling Gear Use
Originally Posted: October 12, 2015
Gearing on a bicycle enables the rider to traverse differing terrain while maintaining a comfortable pedaling speed, known as “Cadence”, and road speed. For instance, a cyclist with just one gear, riding on flat terrain at 20 mph and pedaling at 90 RPM would have to slow their pedaling speed to just 45 RPM while riding uphill at 10 MPH. Not only is pedaling at 45 RPM going uphill difficult, it also puts excessive stress on the rider’s body and is inefficient; most people’s optimal pedaling speed is 90RPM (Neptune, Journal of Biomechanics 409-415). Thus, it is desirable to have a set of gear ratios to use while traversing varying terrain.
The race for market share in the world of cycling while trying to meet this need has driven growth from bicycles with 10 speeds in 1983 to cycles with 20+ speeds in 2015. This level of gearing requires narrower chains and higher precision shifting mechanisms, thus adding cost and complexity to the machines. It is interesting to note that while the number of gears on a racing bike has steadily increased, the gearing range hasn’t. This has resulted in redundant gear ratios throughout the available range on most bikes. New drivetrains are now placing an emphasis on simplicity by including fewer gears in total while providing a similar number of unique gear ratios. To understand how many gears are truly needed, the author analyzed gear usage during rides on a variety of terrain.