SEC Filings Graph - Identifying Related Firms From More Than 52 Million SEC EDGAR Searches
Originally Posted: November 26, 2017
Graphs let us model the world as it is, with nodes that represent physical entities and edges connecting nodes based on the relationships between them. Inspired by the work of Lee et al., I took the Thanksgiving weekend to build a graph of SEC filings. In this post, I use the EDGAR Log File Dataset, from April 2016 through March 2017, and Neo4j to build a graph of 52,611,188 searches for 5,388,574 reports by 476,827 users. The graph leads to interesting connections between firms and could be extended to include more relationships and entities from other domains such as textual similarity of filings, employment histories of material employees, and patent applications.
Search-Based Peer Firms
In Search-Based Peer Firms: Aggregating Investor Perceptions through Internet Co-Searches, Lee et al. (2014) show that peer groups can be constructed from web logs of searches on the SEC’s EDGAR website which explain more variation in economic variables than traditional GICS6 industry classifications. Using the logs from January 2008 to December 2011, Lee et al. built peer groups from searches on the EDGAR website by the same user which occur one after another. As an example, let’s take the user who searches for Apple and then Google. We would then infer that Google may have some relation to Apple. This is what the authors refer to as a Co-search, and aggregating all co-searches for a target firm allows us to calculate a search fraction metric. This metric represents the portion of all searches related to the target firm that were followed by a search for a candidate peer firm. We can then rank the peers based on search fraction with the assumption that more related firms will receive a higher search fraction. I encourage the interested reader to dig into the paper to learn more!
After calculating peer groups, Lee et al. measure economic relatedness of the group using data from the Center for Research in Security Prices (CRSP), Compustat, and I/B/E/S. Here, I use the 4 most recent quarters of EDGAR web logs (as of this writing), but do not attempt to quantify the relatedness of the firms because I don’t have access to the datasets to do so.
A Graph-ical Representation
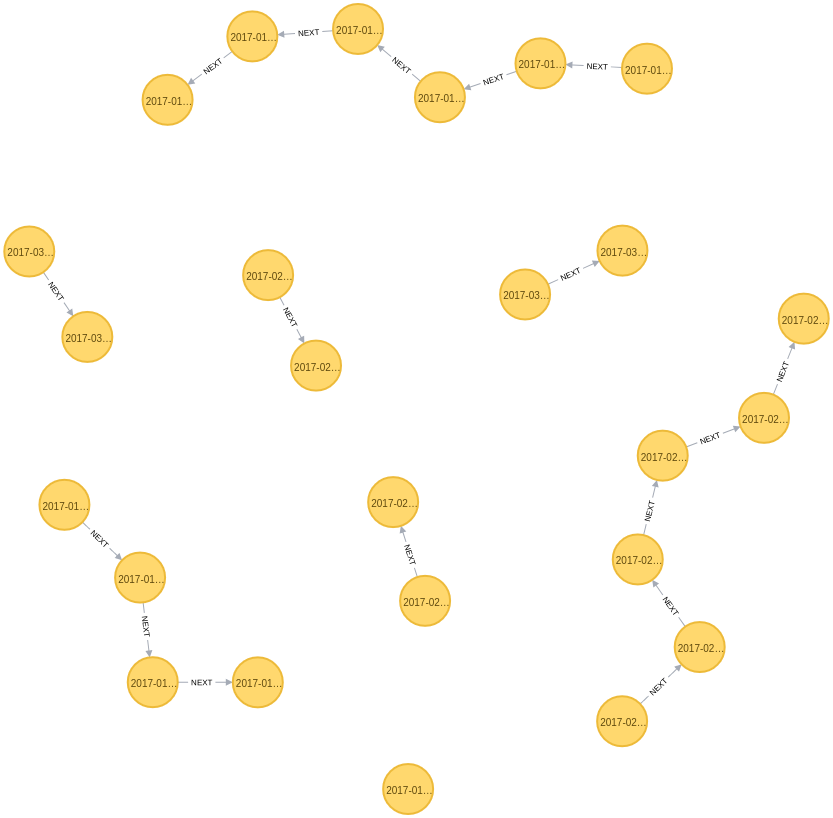
The underlying intuition for why co-searches would add value to finding peer firms is similar to the concept of n-grams in language modeling: When two items frequently appear in context together, they must have some underlying relation. Another way to view co-searches is by using a graph where each search is a node, and subsequent searches are connected by a NEXT relationship, as shown below.
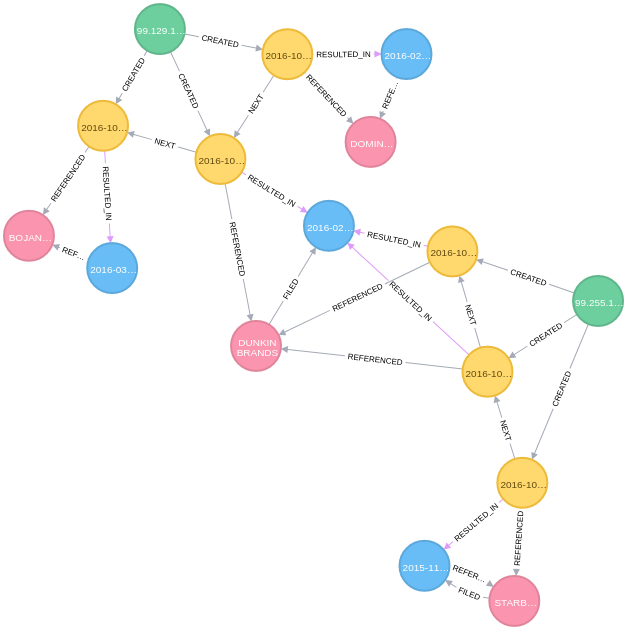
But with a graph, we can easily build representations of the world that capture more than just sequences of searches. In Figure 2 below, I’ve added nodes for firms (pink), reports (blue), and users (green), and modeled the relationships between them such as firms being REFERENCED in searches and reports, firms filing reports, etc.
Since I am originally from the East Coast and am enjoying my morning coffee, I figured an example using Dunkin Donuts was in order. Figure 2 contains the searches (in yellow) of two users (in green) which resulted in the reports (in blue) which were filed by Dominos, Starbucks, Dunkin Donuts, and Bojangles (clockwise from top, in pink). From the graph view, we can readily see that the user on the top first looked for data on Dominos, then Dunkin Donuts, and finally Bojangles. Similarly, we see that the user on the right started looking for data on Starbucks before arriving at Dunkin Donuts.
To me, representing the data this way makes it easier to understand what is happening and feels like a more natural view of reality than the tables of relational databases (RDB) and spreadsheets with which many of us are familiar.
Graph Building
The data for the graph comes from publically available web server logs for the SEC EDGAR website known as the SEC EDGAR Log File Dataset. Specifically, I use the most recently available four quarters worth of data, 04/2016 through 03/2017. The data is pre-processed with the main goals of excluding robots or web crawler traffic and eliminating searches from users who only search for a single firm. These steps are:
- Exclude any searches from self-identified robots and traffic that didn’t originate from the SEC’s search tool
- Within any given day, exclude traffic from users who searched for more than 50 unique company identifiers (Lee et al. employ a similar heuristic) and less than two unique companies
- Include only searches for SEC form types 10K, 10Q, 8K, S1, and 14A.
The filtered data is then written out as comma-separated files, representing the nodes and relationships in the graph, which can be readily imported to Neo4j. I plan to make the scripts to download and process the log file dataset available in the near future. The result is a graph containing (a) 65,892,854 nodes of types: Companies, Reports, Searches, and Users, and (b) 211,959,850 relationships of types: CREATED, FILED, NEXT, REFERENCED, and RESULTED_IN.
Querying the Graph
I chose to use Neo4j to store my graph based on reviews, a nice Python interface, and its documentation. Neo4j’s query language, Cypher, is very easy to use and quite intuitive because it was designed to make queries look like ASCII-art (which admittedly means that writing queries can be verbose and annoying at times). For example, the query below finds all search-based peers for Dunkin Brands, which has an SEC Central Index Key (CIK) of 1357204.
MATCH (firm:Company {cik: "1357204"}),
(firm)<-[:REFERENCED]-(:Search)-[:NEXT]->(:Search)-[:REFERENCED]->(peer:Company)
RETURN firm, peer
Another benefit of using a graph to represent the search data is that it makes it easy to calculate peer groups using not only co-searches but also searches that are any n-hops away from the search for our target firm. The query below will return peers that are up to 5 hops away from our target.
MATCH (firm:Company {cik: "1357204"}),
(firm)<-[:REFERENCED]-(:Search)-[:NEXT*1..5]->(:Search)-[:REFERENCED]->(peer:Company)
RETURN firm, peer
Storing the data as a graph enables us to quickly explore changes like this, whereas doing so in an RDB would require tedious operations to build the links between searches n-hops away.
Example Peer Groups
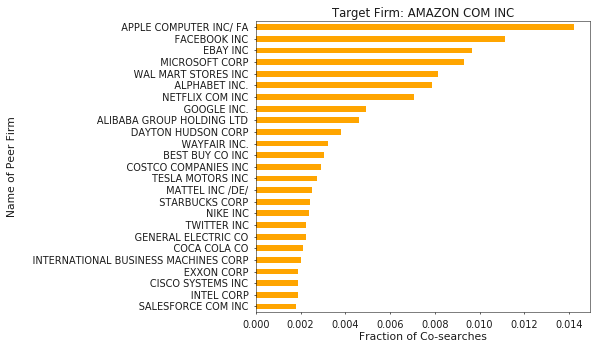
Building on the Cypher query above, we can generate peer groups using the query below which calculates each peer’s search fraction of our target firm’s searches. Doing so is quite fast, so I constructed groups for the 5000 most frequently searched firms. You can download peer groups for these firms, which include the top 25 most comparable firms based on search fraction, here.
// Count total searches for target firm
match (n:Company {cik: "26172"})<-[:REFERENCED]-(s:Search)
with count(*) as total_searches
// Calculate search fraction for each peer
match (firm:Company {cik: "26172"}),
(firm)<-[:REFERENCED]-(:Search)-[:NEXT]->(:Search)-[:REFERENCED]->(peer:Company)
where peer.cik <> "26172"
with peer, count(*) as searches, total_searches
return peer.name, peer.cik, searches, toFloat(searches)/total_searches
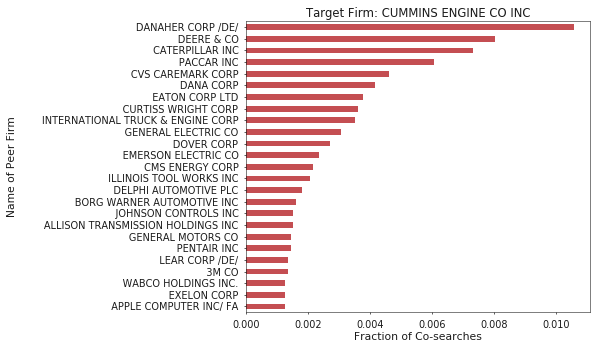
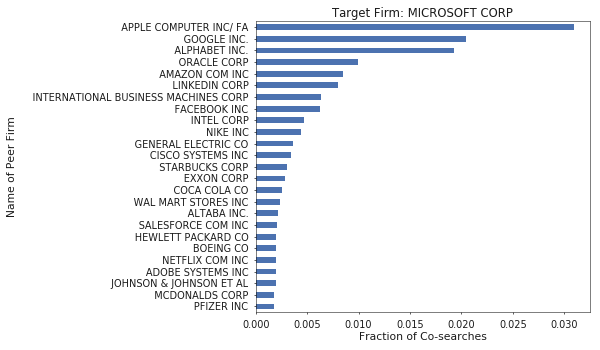
order by searches descHere are some example results for the firms where I have previously worked. Qualitatively, I think the groups look reasonable.
Conclusion and Future Work
Building a graph from the SEC EDGAR Log File Dataset allows us to derive insight into the firms that EDGAR users believe are related, and builds a foundation for much more interesting analytics. For instance, including the economic data that Lee et al. considered would allow me to quantitatively explore groupings based on peer firms that are related by searches n-hops away from the target, perhaps with some penalty on distance. Further, the network can be used to identify users or filers (some firms file reports on behalf of companies) who are experts in a certain area of business. Grouping based on the companies on which these experts focus, may yield interesting results. Lastly, additional data from other domains can be added to the graph, such as other SEC form types, equity analysts, patent applications, or job postings, which can then be used to build relationships between the firms. This would enable me to explore groupings based on data from multiple domains. Based on other work, analyst co-coverage (Lee et al. 2015) and technological links between firms (Lee et al. 2017) look promising.