Search-Based Peer Groups - Aggregating SEC EDGAR Searches to Beat SIC Codes
Originally Posted: January 01, 2018
In this post, I show that search-based identification of peer firms yields groups which transcend traditional industry classification codes and use stock return data to show that they are more economically related. This indicates that investors may be better off using more novel means of finding comparable companies than relying solely on traditional Standard Industrial Classification (SIC) codes. Building upon my last post, SEC Filings Graph, which explored logs from one year of searches on the SEC’s EDGAR website to identify related companies, I expand the data to searches from January 2008 through March 2017 and implement quantative measures of economic relatedness between the firms within a peer group. The resulting dataset (previous dataset) has 407,574,804 (52,611,188) searches for 9,583,773 (5,388,574) reports by 3,043,255 (476,827) users. My work is inspired by, and roughly follows, the methodology of Lee et al. who studied search data for 2008 through 2011.
Motivation
Peer groups are used extensively for benchmarking activities such as corporate valuation. For example, during my valuations and private equity coursework, we often had to identify “Comparables” or similar companies to our target firm. A frequent question from students was “How should these firms be selected?”
One of the common methods is using classification codes such as Standard Industrial Classification (SIC) or Global Industry Classification Standard (GICS). The assumption when using these codes is that given a target firm, its peers can be identified by looking at firms which share the same code. The codes are organized in a hierarchy such that the first digit of the code is the broadest category and each subsequent digit provides further specificity. But, even at the finest level of detail, eg. the full SIC code, there are often tens of firms in the group, leaving the analyst to ask “Which of these is most related to my target firm?” Search-based identification of peer groups aims to solve all of these issues by not only providing relevant peers but also a ranking of each related peer.
A Brief Introduction to Graphs and Co-Searches
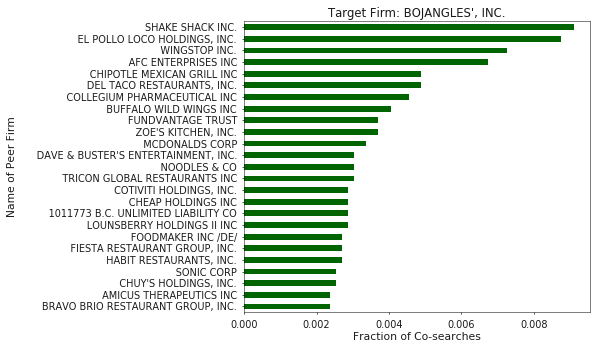
The basic idea behind “Co-Searches” or search-based peer firms is that humans searching for things will often search for two related items one after another. Thus, by analyzing patterns of co-searches, related web pages, products, or companies can be identified, an example of which is shown in Figure 1.
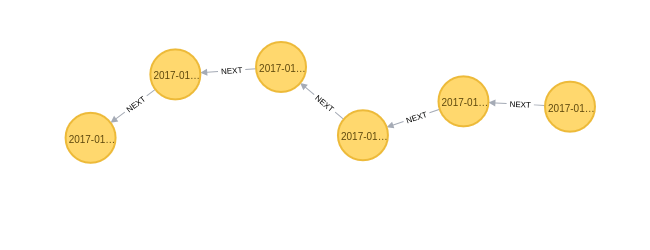
At a very high-level, a graph is a data structure which models things and the relationships between them. At this point, you can probably see how web logs lend themselves nicely to being modelled as a graph. Such a graph’s nodes could be users, webpages, searches, etc and each user interaction could be connected by “NEXT” relationships, as shown below. As a result,sequences of interactions are captured in the graph (These are often referred to as clickstreams).
The authors who coined the term “Co-Search” focused primarily on pairs of searches, where related items are identified only by interactions that happen immeadiately after one another. But, by modelling this domain in a graph we can quickly identify items or firms that are related by greater distances.
For an indepth introduction to graphs and search-based peer firms, see my prior post, Wikipedia’s article on graphs, or read the original paper Search-Based Peer Firms: Aggregating Investor Perceptions through Internet Co-Searches.
Search Data
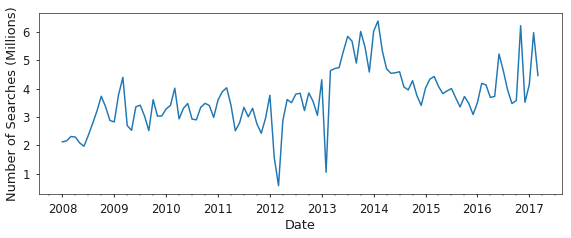
While the dataset from EDGAR contains searches for many companies, filers, and individuals, as shown in Figure 3, I limit the searches considered to only contain companies which are part of the SP1500 as of December 26th, 2017. This is driven by the desire to find economically related businesses, not necessarily individuals, and a limit on the stock return and company metadata that I have readily available. The list of companies included in my analysis is available here. Additionally, the search data is filtered to exclude robots and include only certain SEC form types according to the process outlined here.
Descriptive Statistics of Search-Based Peers
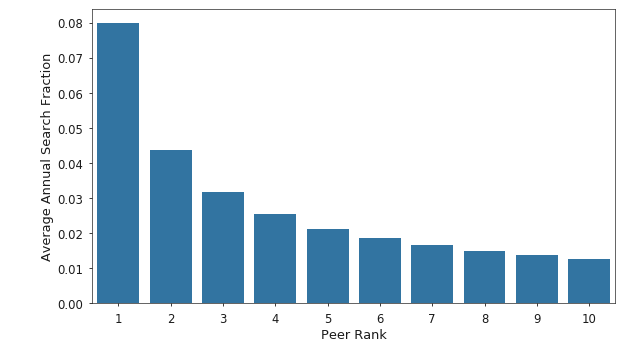
Figure 4 shows the distribution of average annual search fraction versus peer rank. For example, in 2017, the top ranked peer on average accounted for 6% of the traffic to its peer. Additionally, the distribution appears to follow a power law as shown by the linear shape of the log-log plot on the right side of Figure 4 and the high R-squared coefficients for a linear fit of the log-log data, as shown in the legend.
Considering just the head of the distribution, the top peer, as ranked by traffic volume, accounts for nearly twice the traffic on average as the next closest peer. This indicates that a small number of peers account for most of the traffic related to a target firm. Figure 5 shows the average annual distribution of search traffic for the top 10 peers.
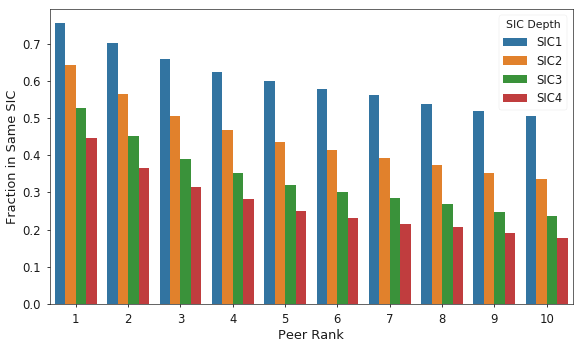
As mentioned in the motivation section, industry classification codes are often used to identify peer firms in practice. To facilitate a comparison between this traditional method and the SBP approach, I use SIC codes for each firm, extracted from the SEC EDGAR website. The following analysis is then conducted: for each peer rank, compare the peer’s SIC code of a specific depth, first digit, first through second digit, and so on, with the SIC code of the target firm. This data is then aggregated into Figure 6, which shows the fraction of firms at each peer rank and SIC depth which share the same code as the target firm.
Figure 6 shows that across SIC code depths, as peer rank decreases, so does the likelihood that the peer and target firms will share the same code. Further, even at the broadest level of depth one, which contains only 10 categories, the top peer’s industry differs from the target firm’s roughly 25% of the time. This evidence shows that the SBP approach is useful for identifying potential comparable companies that would not be selected using the traditional industry classification codes.
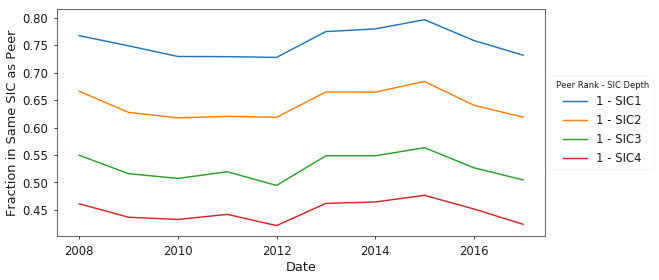
Given the strong disagreement between the SBP approach and SIC codes, it is interesting to note that this is not necessarily a new trend, as shown qualitatively in Figure 7.
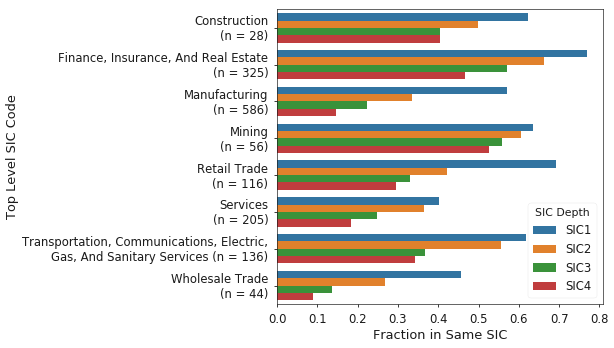
By-industry results for the fraction of peers which share the same SIC code as the target firm are shown in Figure 8. Qualitatively, it is apparent that the agreement between SBP and SIC codes is higher for certain industries over others; Finance especially appears to have high agreement. This further shows that investors should consider the industry they are studying when selecting a method for identifying peer groups.
Economic Relatedness of Peer Groups
Economic relatedness within peer groups is measured using a method proposed by Lee et al. (2014). Specifically, for each year in the sample, portfolios of peer firms are built using (a) a random selection of 10 firms sharing the same SIC code as the target, (b) the top 10 search-based peer firms, with equally weighted holdings within the portfolio, and (c) the top 10 search-based peer firms, with traffic weighted holdings. Then, for each month in the subsequent year the cross-sectional regression on stock returns, defined below, is estimated.
\[\begin{align*} & R_\text{i,t} = \alpha_t + \beta_tR_{p_i,t} + \epsilon_\text{i,t} \\ \end{align*}\]Where \(R_{i,t}\) is the monthly stock return for the target firm \(i\) in the month \(t\). Similarly, \(R_{p_i,t}\) is the monthly stock return on a portfolio of peers for target firm \(i\) in the same month \(t\). For example, search data from 2010 is used to build portfolios that are then used in the regressions on stock return data from 2011. By using search data that was available prior to the months in which I use stock return data from, look-ahead bias is avoided. The R-squared coefficient from these regressions is then used as a becnhmark to compare the various methods of building peer groups. See Lee et al. (2014) for more details on the motivation behind this metric.
The findings in Table 1 indicate that over the sample period, both search-based approaches significantly outperform peer groups generated from SIC codes. Columns 1-3 show the average statistics for the monthly regressions. Columns 4-6 show the differences between the mean R-squared values for each approach. The value N in parentheses indicates the monthly average number of companies in the sample. Monthly average standard errors for the regressions and standard errors for the difference in means tests are shown in square brackets. Statistical signifigance is indicated by *, **, and *** representing levels of 10%, 5%, and 1% respectively.
Table 1: Comparison of Monthly R-squared Values
| SIC | SBP EW | SBP TW | (2)-(1) | (3)-(1) | (3)-(2) | |
|---|---|---|---|---|---|---|
| (1) | (2) | (3) | (4) | (5) | (6) | |
| Average (1-3)/ Difference (4-6) Monthly R-squared | 0.274*** | 0.313*** | 0.336*** | 0.039*** | 0.062*** | 0.23** |
| (N = 1386) | [0.008] | [0.008] | [0.006] | [0.014] | [0.014] | [0.015] |
| Number of Months | 106 | 106 | 106 | 106 | 106 | 106 |
Since I have been following the methodology of Lee et al. (2014) closely, I will also present my results for the same time period as in their work. Figure 9 shows that (a) despite using adjusted returns from Yahoo! Finance, the results for the SBP’s are similar to Lee et al. and (b) both equal and traffic weighted search based approaches outperformed SIC codes by 14.2% and 22.6% on average, respectively. An additional note is that my baseline case uses SIC codes whereas Lee et al. used GICS codes.
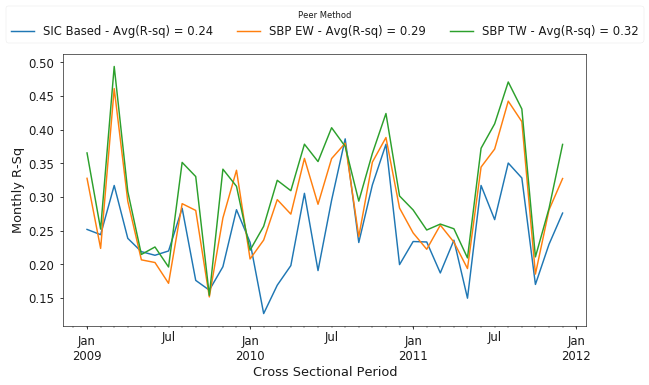
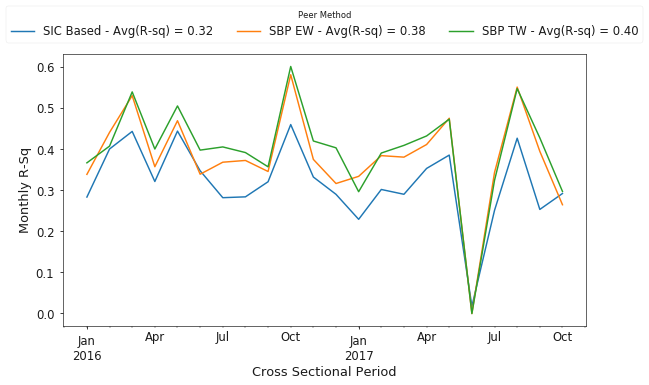
Figure 10 presents results from more recent years, 2016 through November 2017. Again, we see that the search-based approach outperforms SIC codes, with equal and traffic weighted approaches having a 19.5% and 25.5% increase in average R-squared values for the cross-sectional regressions than the traditional SIC code based method.
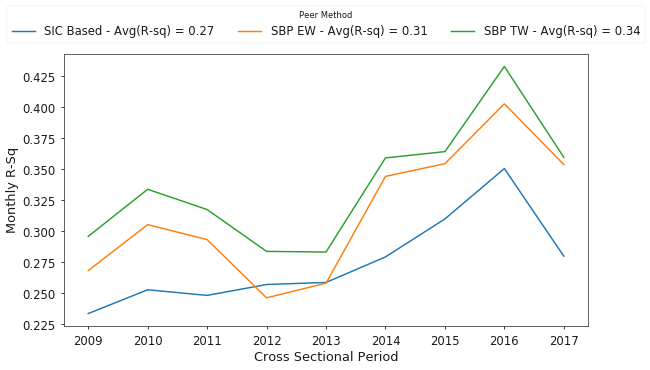
Lastly, Figure 11 shows the complete time history of results for annual average R-squared values over the entire sample, from 2008 through November 2017.
Conclusions and Future Work
While SIC codes explain a significant amount of the variation in monthly stock returns, we see that both search-based approaches significantly outperform the SIC codes. Additionally, the value added by the traffic weighted approach over equal weighting is significant, but only at a 10% level. Given the number of preprocessing and filtering steps required to arrive at these numbers, such as attemping to exclude robots and selecting search traffic only for specific types of forms, it would be interesting to explore how these factors affect the results between the two search based approaches.
For future work, I want to explore how the efficacy of the search-based approaches has evolved since Lee et al. first published their work. I think this is especially interesting because their thesis is predicated upon the idea that EDGAR users are fairly sophisticated and thus there is value in their search patterns. But since their work was originally published, the SEC has made strides to make the EDGAR website more user friendly. Have these changes reduced the barrier to entry, enabling less knowledgeable investors to make use of the site, and reduced the collective wisdom of EDGAR users?
Continuing on the theme that not all EDGAR users have the same wisdom, I want to apply algorithms such as PageRank to the graph to identify relative importance of the various actors in the graph. Those results could then be used as another weighting factor when building peer groups from the search data.
Lastly, it seems quite uncommon to use 10 peer firms, it was uncommon in school anyway, when carrying out benchmarking activities. Since most of a target firm’s annual search fraction is concentrated in just a few firms, I’d like to explore how the above results change when the peer groups are only 3-5 firms in size.